
I teach visual science communication to researchers
☐ Designing an effective graphical abstract, conference poster, or publication figure
☐ The science behind visual communication (cognitive psychology & visual perception)
☐ Apply design principles to clearly communicate your message
☐ Introduction to Adobe Illustrator, Inkscape, Affinity or RStudio
My teaching approach
Visual communication of research findings is best learned by doing. I combine theory with sketching, hands-on exercises, discussion and feedback sessions. Participants work with their own research, making the learning directly relevant to their work.
I want to make visualisation approachable and fun, and help researchers develop the practical skills and the critical eye to create effective scientific visuals for their research.
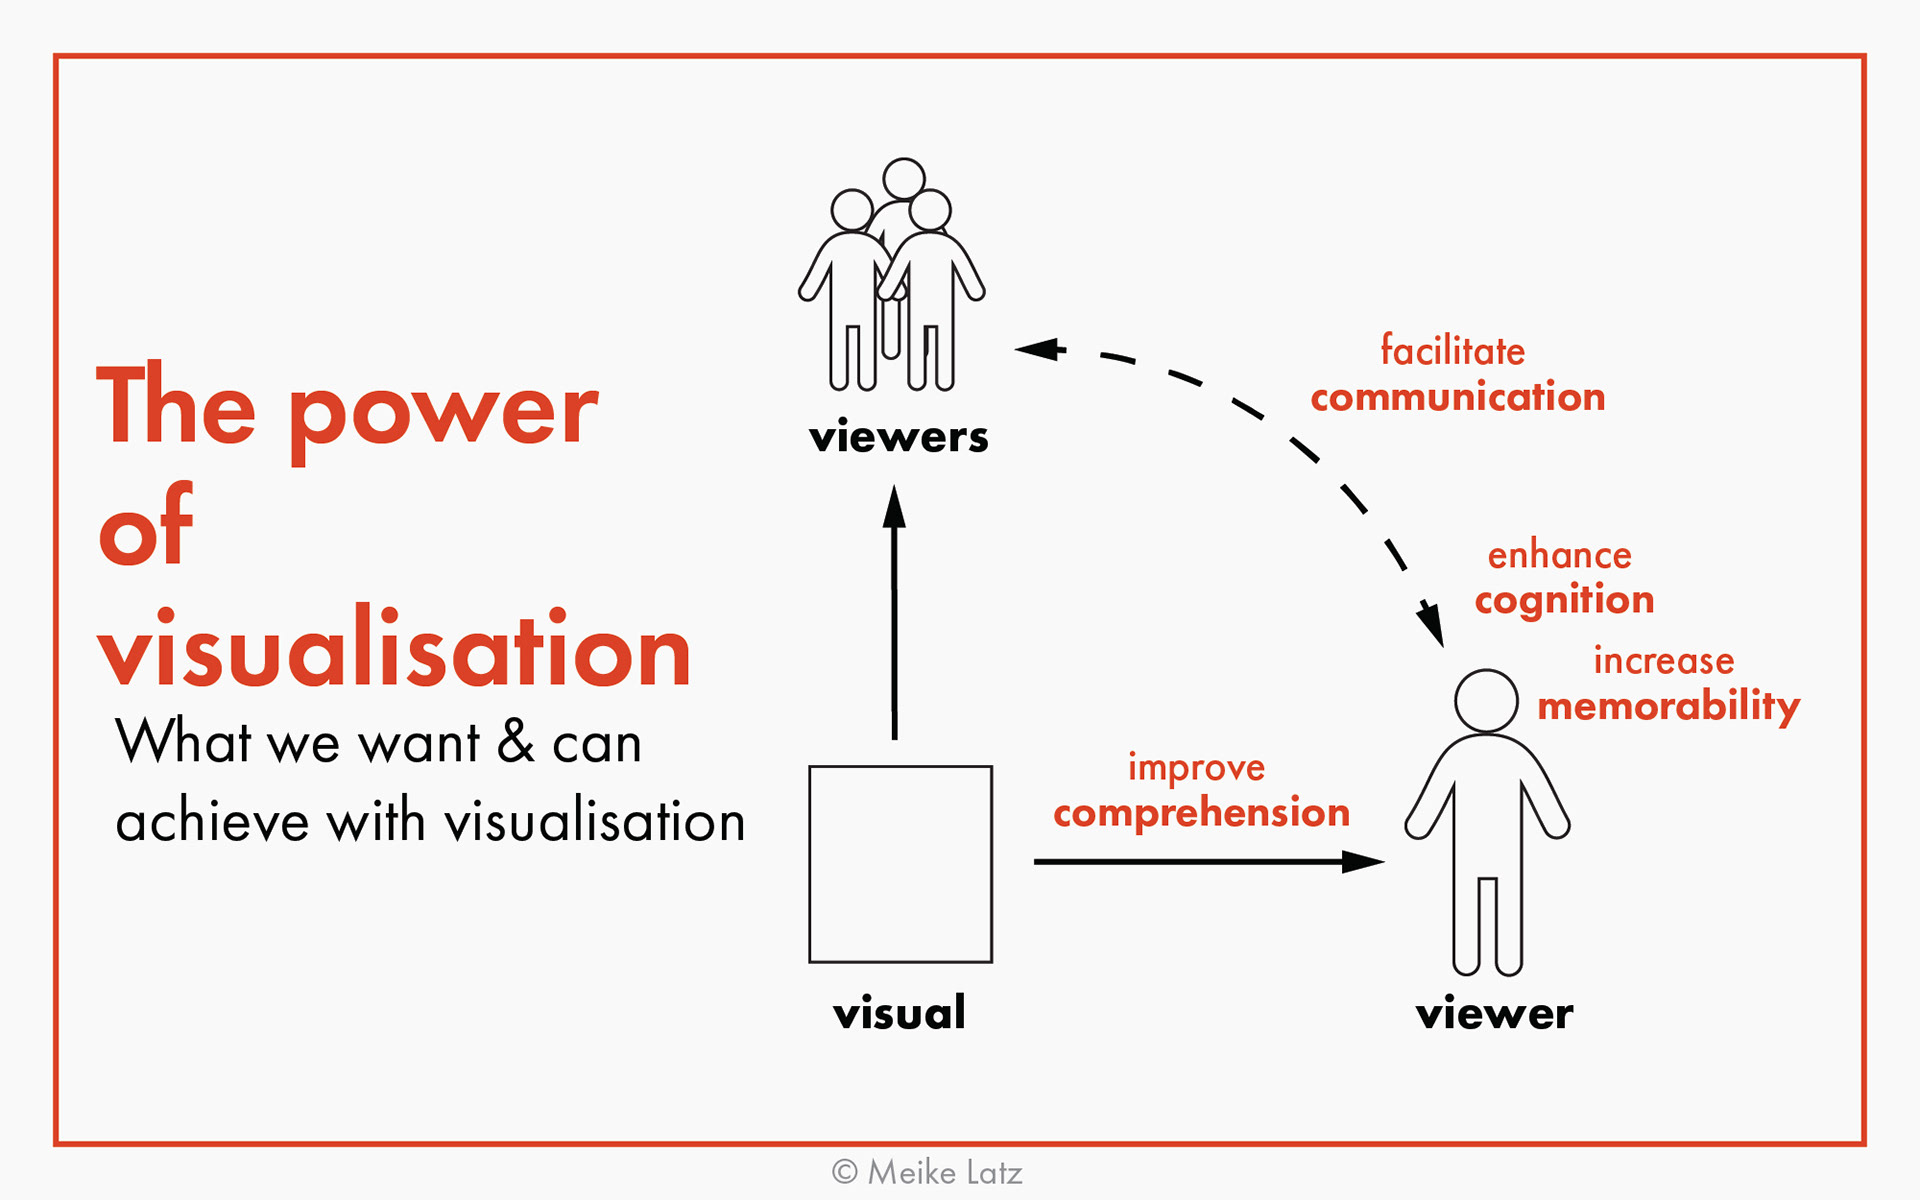
The power of visualisation
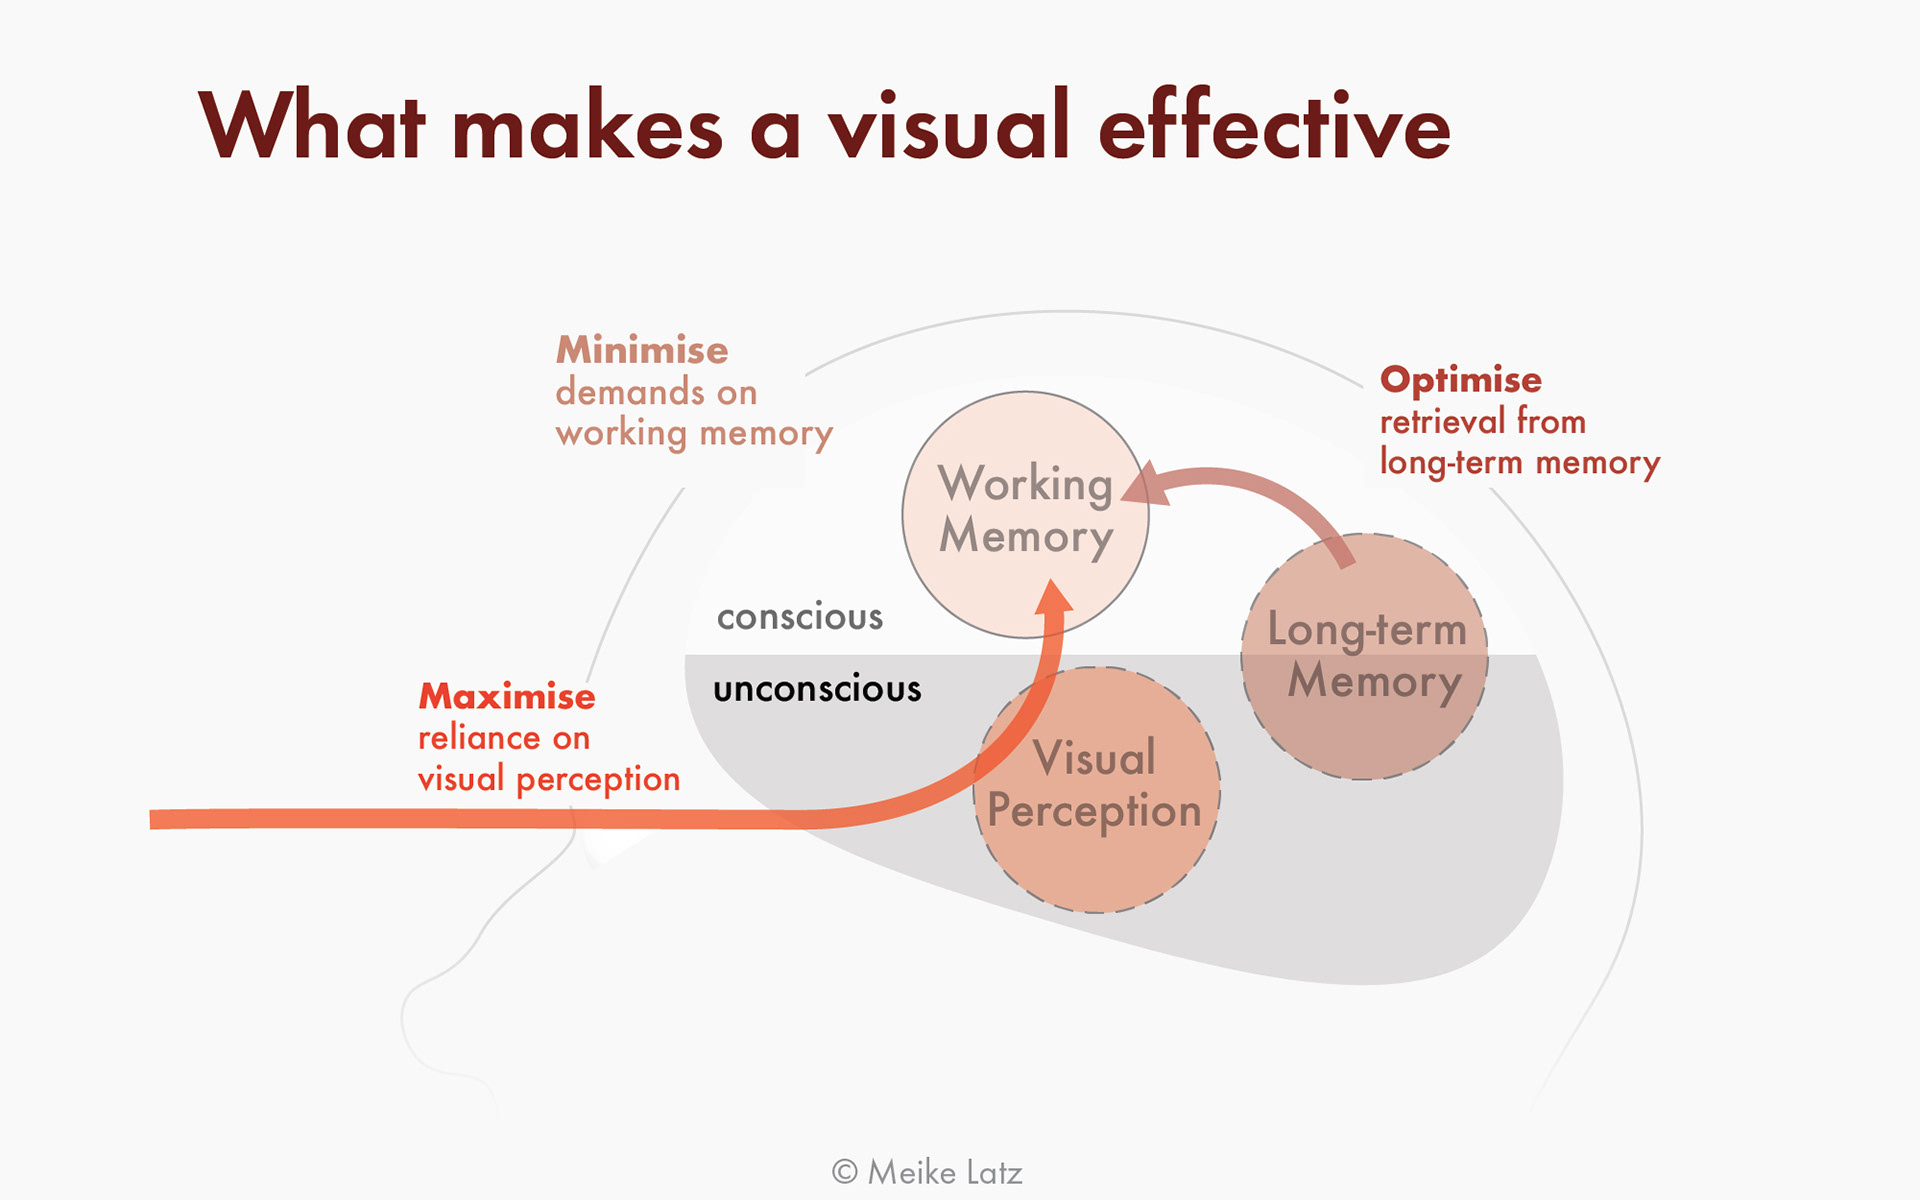
Creating effective visuals
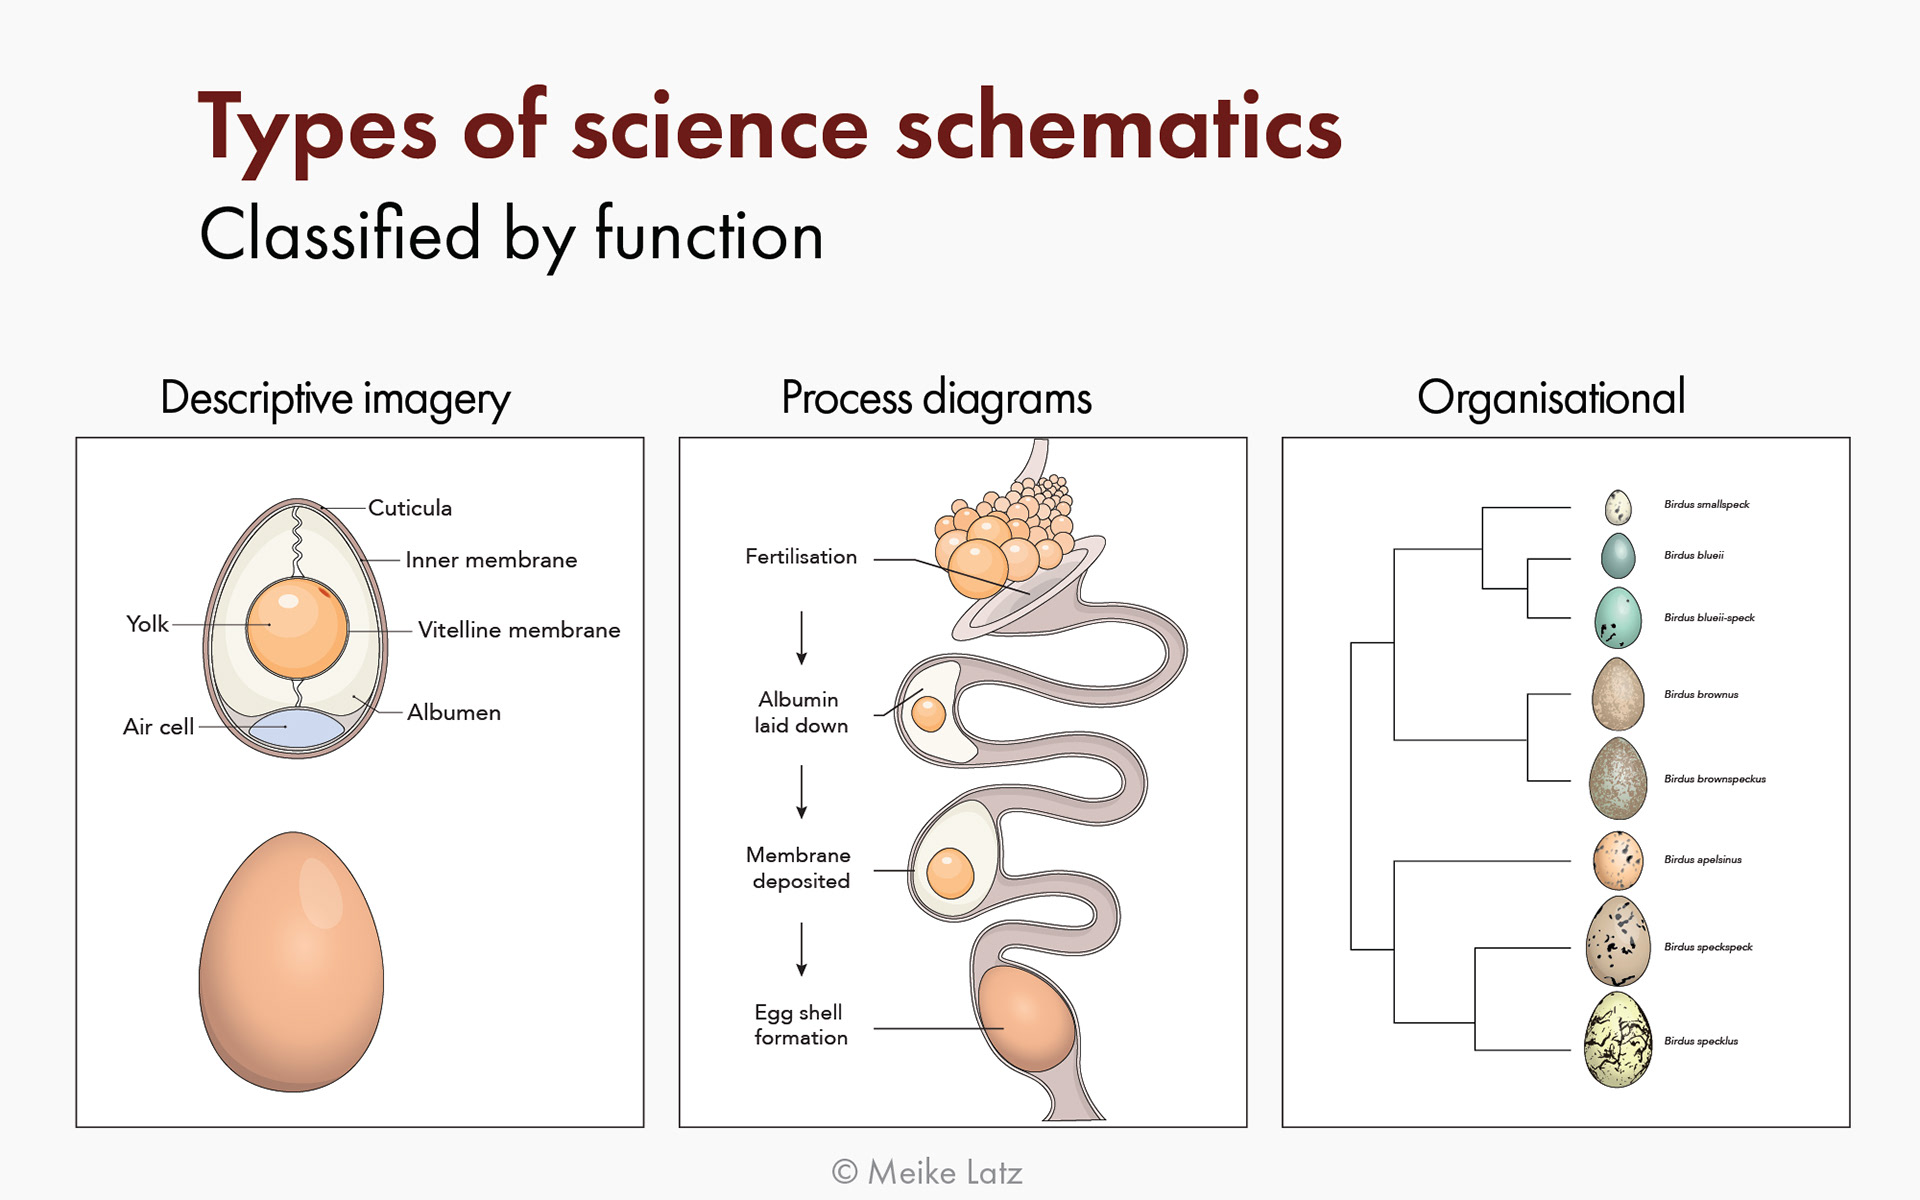
Types of schematics
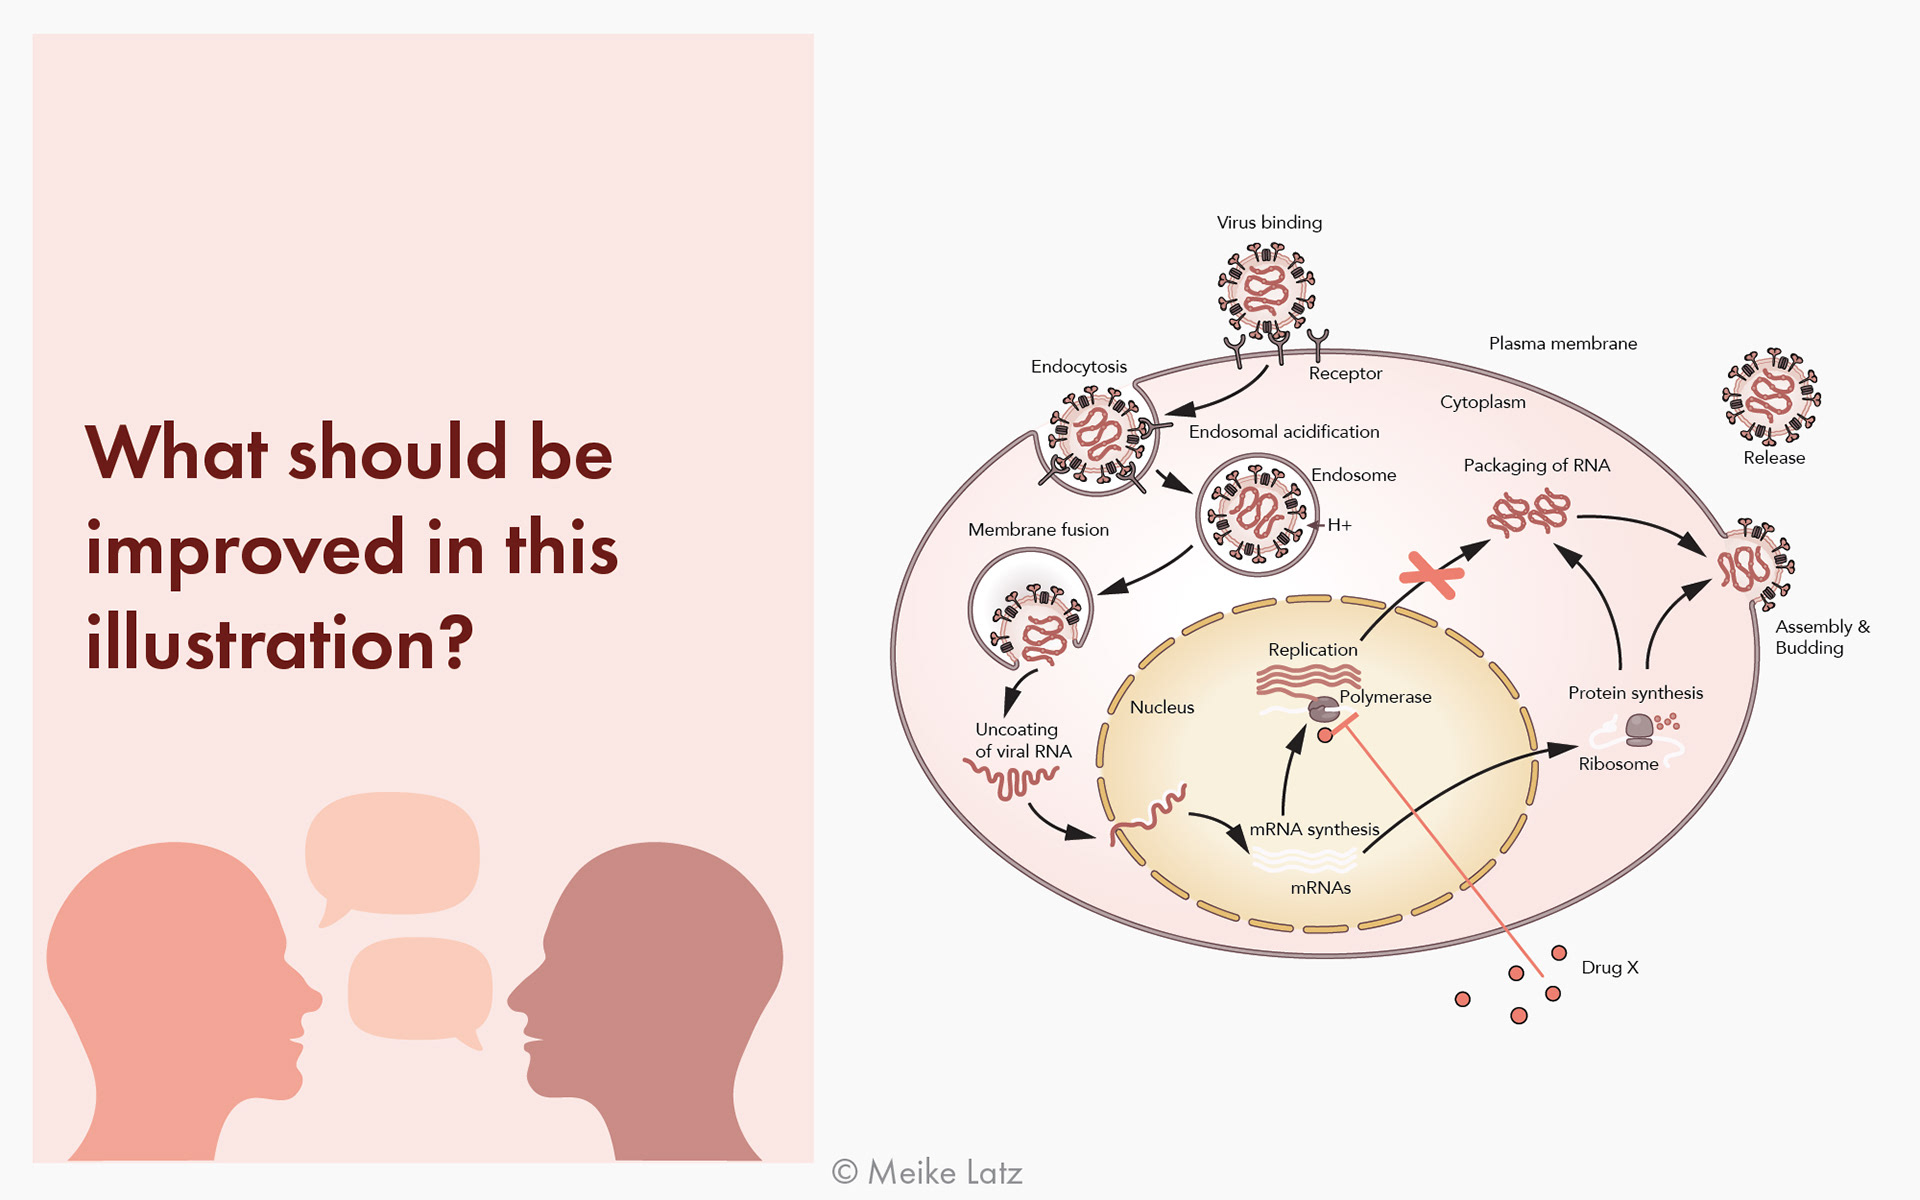
Exercise: Improving a visualisation
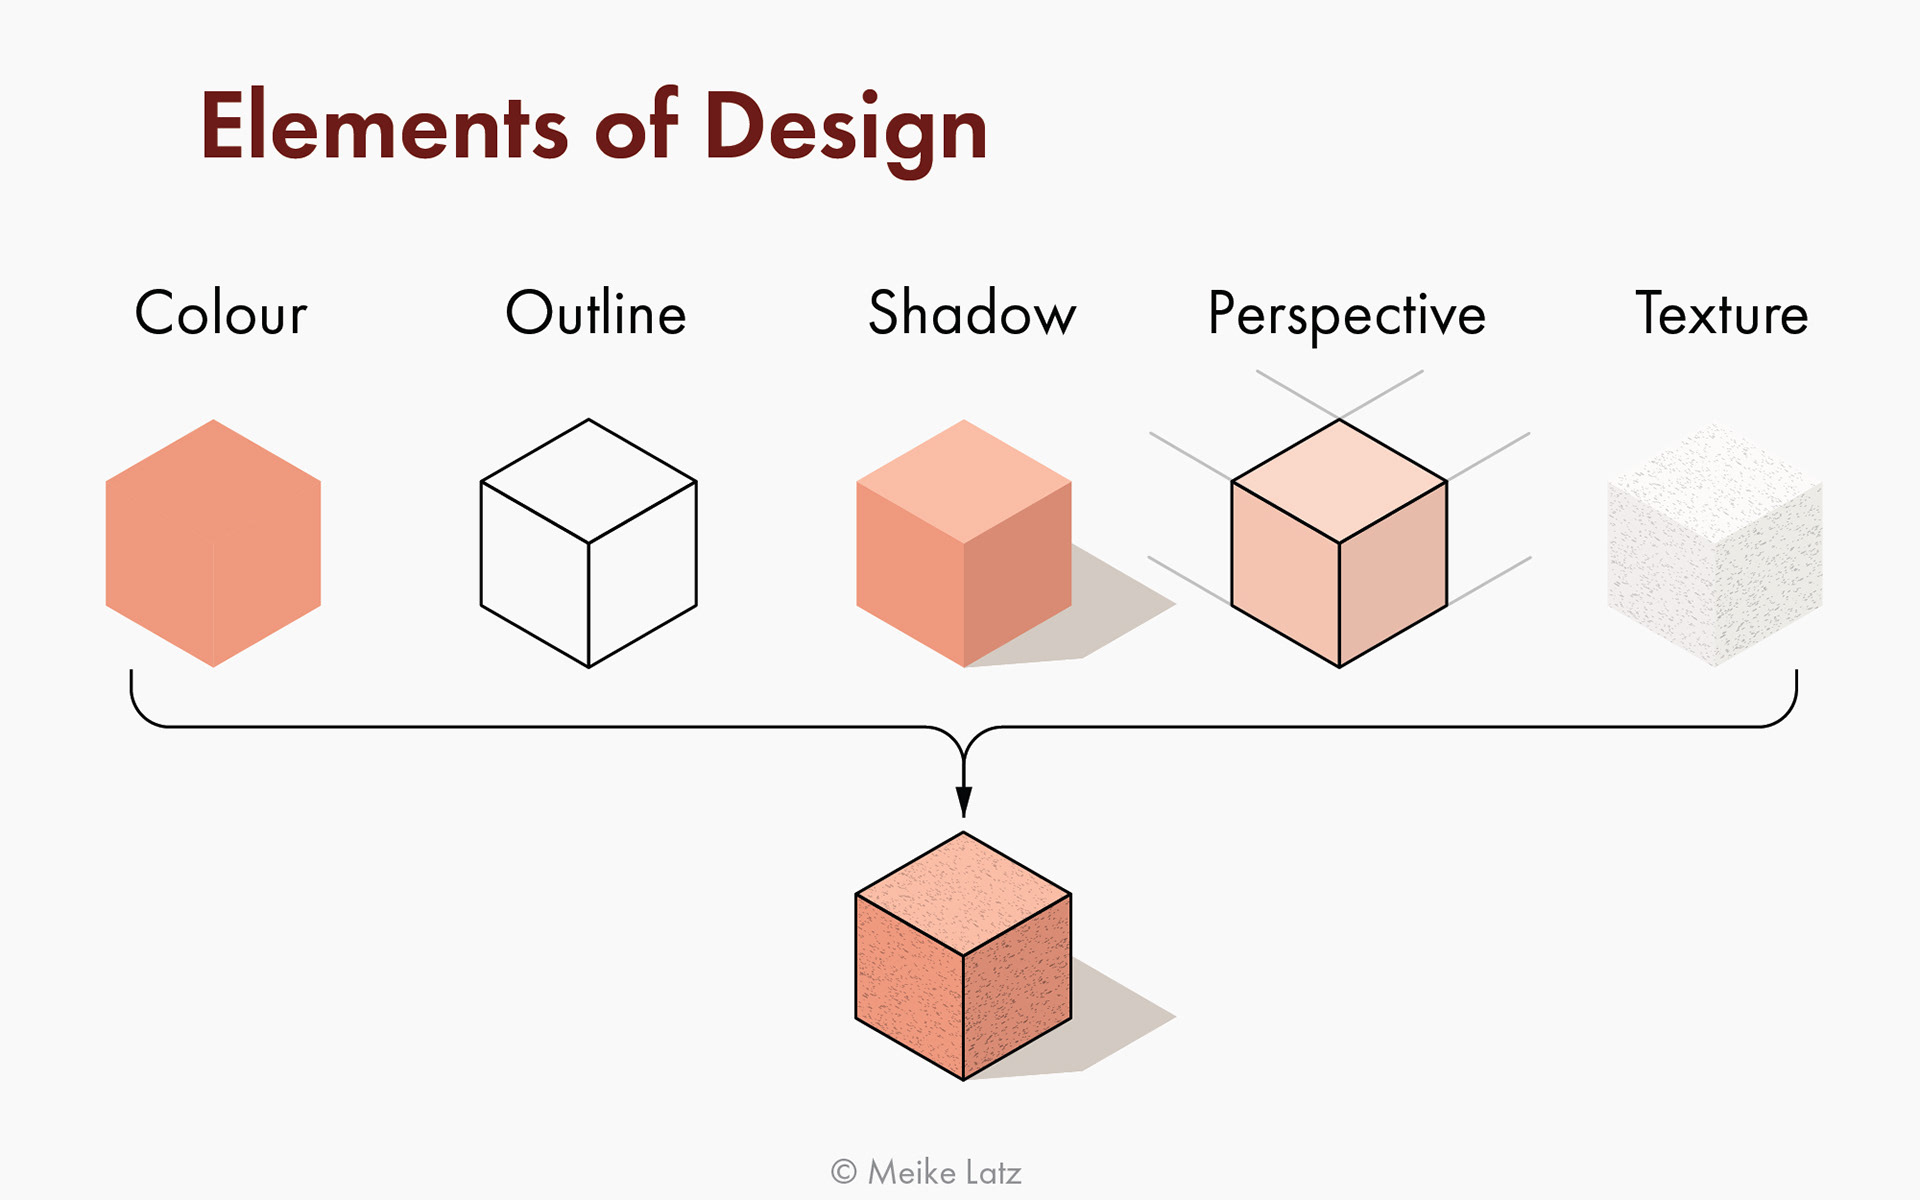
Elements of Style
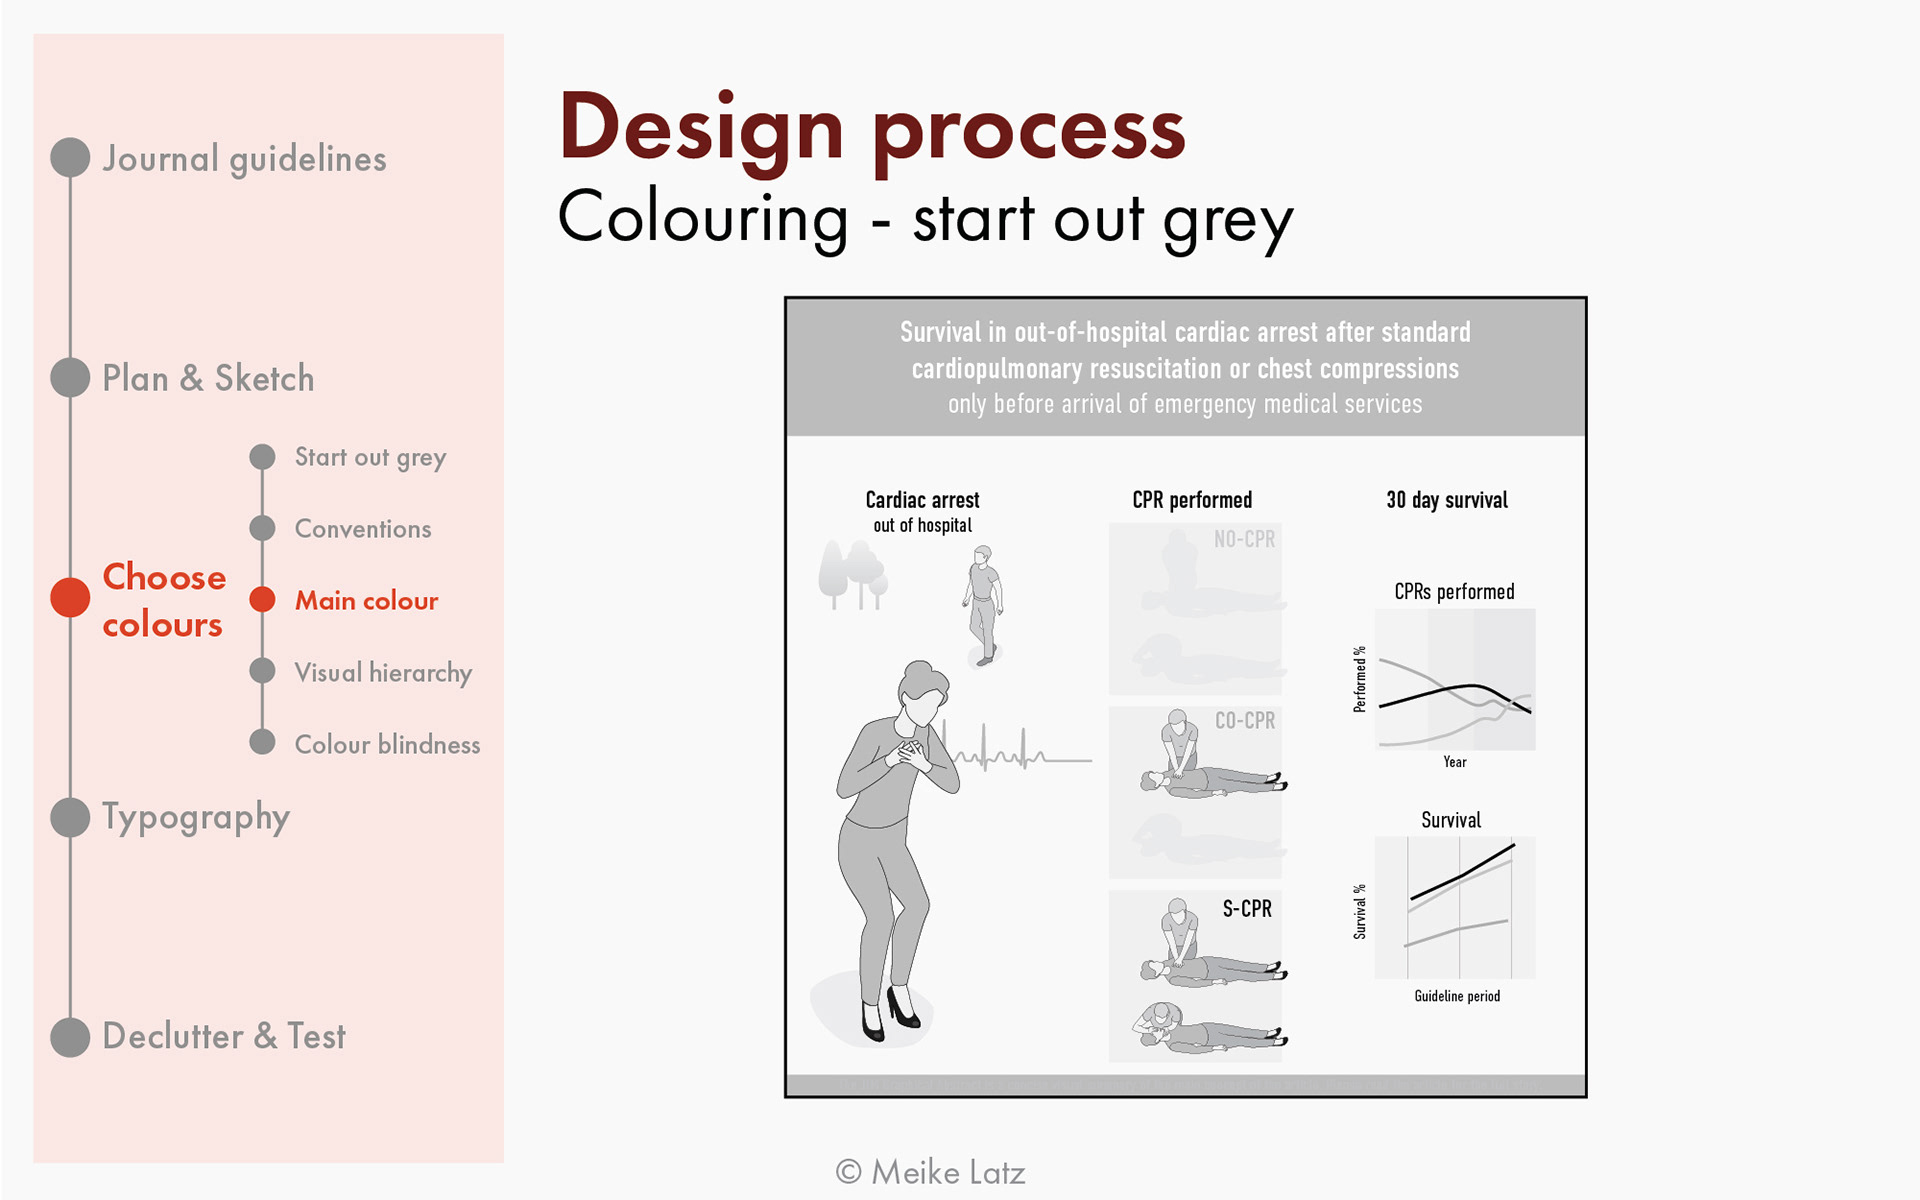
Design process of a graphical abstract - applying colour
Past teaching occasions (selection)
Biannual since 2023: PhD course ’Scientific Illustration and Data Visualisation’ at Karolinska Institute, 2 weeks (3 ECTS). Link to course and course evaluations spring 24 and autumn 24.
2026-03-10 International Brain Research Organisation (IBRO) - Workshop on effective data visualisation (4 h)
2025-11-05 Danish Ramazzini Centre - Workshop on making graphical abstracts (2 h)
2025-06-24 Photosyntech (PhD school) - Workshop on designing conference posters (6 h)
2025-05-23 Riksrevisionen - Talk on using visualisations in audit reports (1.5 h)
2025-05-08 UiT Arctic University of Norway - Workshop on visual communication and data visualisation (2 days)
2024-08-31 RISE - Seminar on visualising research findings (1 h)
2024-06-18 Scilifelab conference - Workshops on visual communication and the design process (2 h)
2024-02-01 Umeå Plant Science Centre - Workshop on visual science communication (3 h)
2023-08-31 Karolinska Institute - Workshop on graphical abstracts (4 h)
What participants say
All participant feedback was received anonymously.
“You learn a lot from both the teacher, your peers, and yourself, which is unique! Meike is probably one of the best teachers I’ve ever had. She really helps you to look at design as both artist and scientist.”
— Participant, PhD course autumn 2025
“The type of exercises, the pace of the course + the constant feedback led to acquiring an actual skill that we can use for our projects.”
— Participant, PhD course spring 2026
“The amount of things to consider when doing my own visuals was daunting because I didn't know what to focus on exactly, but this course has given me tools and ways to evaluate illustrations, and now I feel capable of defining what I can improve in them myself.”
— Participant, PhD course autumn 2024
“Maike was a great teacher - very knowledgeable and motivated! I think her balance of theoretical input and practical exercises was great. Especially the sketching sessions helped me develop a better feeling on how to start a visualisation process.”
— Participant, PhD course autumn 2025
“The constant encouragement from Meike and the opportunity to receive iterative feedback made a big difference. It felt like a supportive learning environment rather than just lectures. I now feel inspired and confident to develop visuals and graphical abstracts for my research data.”
— Participant, PhD course, autumn 2025
“I really enjoyed the Adobe Illustrator activities to practice. I tried before to learn with YouTube videos but it was highly confusing. Doing the activities like this help to learn how to use the different tools in a simple and helpful way.”
— Participant, PhD course spring 2023
“I really enjoyed to do the assignments because I could use my own data to develop something I could use later on in my publications or presentations.”
— Participant, PhD course spring 2025
The Data Visualization session received exceptionally positive feedback from participants and was one of the highest-rated sessions in the NCAMH professional development series. All participants reported being satisfied with the session, with 92% indicating that they were either very satisfied or satisfied, while one participant (8%) expressed a neutral opinion. Similarly, 100% of respondents rated the speaker's presentation as either excellent (67%) or good (33%). The interactive breakout components were also highly valued, with 100% of participants rating both breakout sessions as very valuable or valuable.
— IRBO workshop feedback report 2026
“The participants were very positive about your workshop and everyone worked consentrated on their own graphical abstract during the afternoon session ( we thought that some may skip this part, but nobody did)”
— Workshop organiser, Danish Ramazzini Centre 2025